
TheSky allows you to add your own chart elements to the Sky Chart. In so doing, TheSky gives you the best of convenience from both electronic and paper star charts.
The My Chart Elements window’s Manage tab contains options to add different chart elements to the Sky Chart. The Export/Import tab is used to save a list of My Chart Elements to a text file (so that they can be imported as a Sky Database if desired) or import a list of objects from a text file.
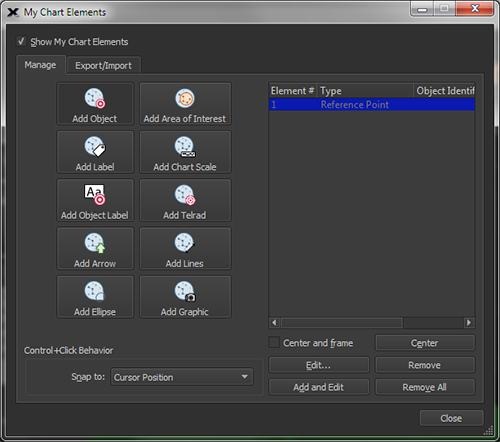
Figure 126: The My Chart Elements window (Input menu).
Show My Chart Elements Checkbox
Turn this option on to show My Chart Element objects on the Sky Chart.
The easiest method to add a chart element to the Sky Chart:
1. Select the My Chart Elements command from the Input menu. The My Chart Elements window opens. At the top left is a checkbox, Show My Chart Elements. Once you have added your own elements, turning this option on will reveal them on the Sky Chart. Notice that there are two tabs in this window, Manage and Import/Export.
2. On the Manage tab, select which element to add by clicking one of the buttons on the left side of the window:
· Add Object: Adds a celestial object to the Sky Chart. The object can be of any type (star, cluster, galaxy, etc.) or one of your own object types (My Object Type).
· Add Label: Adds a text label to the Sky Chart. The Enter Label window will appear so that you can specify the label’s text.
· Add Object Label: Adds a custom label to an existing celestial object.
· Add Arrow: Add a reference arrow to the Sky Chart to point to and highlight a particular object or region.
· Add Ellipse: Adds an ellipse to the Sky Chart.
· Add Area of Interest: Adds a shaded circular region to the Sky Chart for emphasis.
· Add Chart Scale: Adds a small graphic that shows the angular scale for the chart.
· Add Telrad: Adds a Telrad™ Finder to the Sky Chart.
· Add Graphic: Adds a photograph or Scalable Vector Graphic to the Sky Chart.
3. IMPORTANT: Position the mouse cursor over the Sky Chart, then press ctrl+left-click (Windows/Linux) or z+ left-click (Mac) to add the My Chart Element at that position.
Or click the Add and Edit button on the My Chart Elements window. This opens a new window where you can input the necessary information about the element.
Control+Click/Command+Click Behavior
Select how objects are added to the Sky Chart using the options in the Snap To list box.
Snap To Options
· Cursor Position: The My Chart Element is added directly at the current mouse position.
· Nearest Star: Add the element at the same coordinates as the nearest star.
· Nearest Non-Stellar Object: Add the element at the same coordinates as the nearest non-stellar object.
Center Button
Click this button to center the selected My Chart Element on the Sky Chart.
Center and Frame Checkbox
When this checkbox is turned on and the Center button is clicked, the object is placed in the center of the Sky Chart, and the field of view is adjusted so that entire object is visible.
|
|
My Chart Elements are not displayed on, or accessible from the Find window.
My Chart Elements are a special classification of objects and are not accessible from the Find window (page 72).
To locate a My Chart Element object on the Sky Chart:
1. Highlight the object in the My Chart Elements window. 2. Turn on the Center and Frame checkbox. 3. Click the Center button.
The object is now centered at a relatively small Sky Chart field of view. |
Edit and Edit and Add Buttons
Clicking either the Edit or the Edit and Add Button shows the Add/Edit Chart Element window.
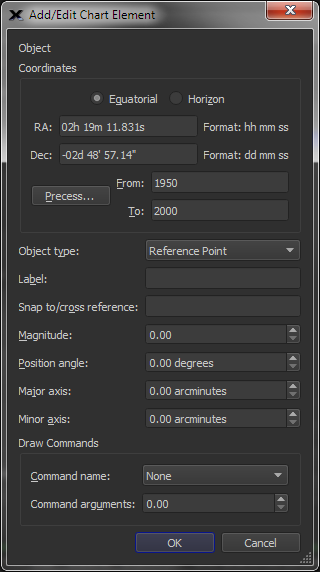
Figure 127: Add/Edit Chart Element window.
Near the top of the Add/Edit Chart Element window, you will see the coordinates section. You can choose between Equatorial or Horizon (azimuth-altitude) coordinates. Also, you can choose to precess the coordinates from one equinox to the current one to update old data. To do this, simply input equinox dates in the fields To and From, and then click Precess. The new coordinates will then appear in the coordinate fields above.
Note: This function works forward or backward. If you would like to precess current coordinates to a past time, you can do that too.
Once you have your coordinates entered, it is time to choose the object type. Using the pop-up menu, choose the object type for your new chart element. Remember that each of these objects can be toggled from various places in the Chart Elements window.
You can then enter Label text, and a Snap to/cross reference point in the appropriate fields.
The next four fields control the actual appearance of your object in the Sky Chart. Magnitude, just like the magnitude of a star, controls the apparent brightness of the object in the Sky Chart (remember that the bigger the number, the dimmer the object). Position Angle controls the angular offset in degrees of your new object and the reference object, relative to the north celestial pole. Imagining your object as an ellipse, input the major and minor axis measurements in arc minutes. Remember that circles are special types of ellipses whose major and minor axes are equal.
Near the bottom of the window are the DRAW commands. You can choose the type of draw command you wish to use from the drop-down menu. You can then enter a command argument into the field below or use the arrows to choose an appropriate argument value.
Once you click OK, you will be brought back to the My Chart Elements window, and your new custom chart element appears in the object list to the right.
You can always edit the element data by clicking Edit.
To center the object in the Sky Chart, click Center.
Clicking Remove All will remove all My Chart Elements.
To change the ctrl+left click (Windows/Linux) or z+ left click (Mac) behavior, use the drop-down menu to the lower left. You can choose to snap to the Cursor Position, Nearest Star, or the Nearest Non-Stellar Object.
When you are finished managing My Chart Elements, click Close.
Remove Button
Click this button to delete the highlighted My Chart Element(s).
Choose the Export/Import tab at the top of the My Chart Elements window. Here, you will be able to export your created chart elements, or you can import other chart elements from a text file.
Follow these easy steps to export your chart elements in Sky Database (SDB) format.
1. To export a chart element, choose Export/Import tab at the top of the My Chart Elements window. The top portion of the window now shows export options.
2. Choose an appropriate identifier and enter it into the first field.
3. Then, from the Default Object Type drop-down menu, choose the desired object type. You can choose from any of the object types used in TheSky.
4. Choose the desired maximum and minimum values for the FOV (Field of View).
5. Coordinate Frame lets you choose between equatorial or horizon (Azm/Alt) coordinate systems.
6. Choose the appropriate equinox, plot order, and cross reference type.
7. Before exporting, be sure to take note of the checkboxes to the top right of the export section. These boxes let you toggle options for plotting objects and their labels, make these objects searchable, and to allow them to be identified with a mouse click.
8. Once you are ready, click the Export to File… button to export your data to a Sky Database file. Simply choose the file’s destination and click Save.
Note: You can also save these data to the clipboard for later pasting.
You can import any chart element(s) from a text file by using the bottom portion of the My Chart Elements window, Export/Import tab. Simply click the From File button to import an existing file. If you have chart element data copied to the clipboard, you can paste those data into TheSky by clicking the button labeled From Clipboard. Additionally, you can change the working directory by clicking the Choose button.
